Scientific Data Graphing
Advertisement

SciDAVis v.0.2.4
SciDAVis is a free software for Scientific Data Analysis and Visualization. User-friendly software for Scientific Data Analysis and Visualisation. SciDAVis is a free interactive software aimed at data analysis and publication-quality plotting.
Advertisement
MaxStat Pro v.3.6
MaxStat is easy-to-use and affordable software for scientific data analysis. Statistical analysis is done in three simple steps within a single dialog window. MaxStat guides user with little experience in their statistical analysis.
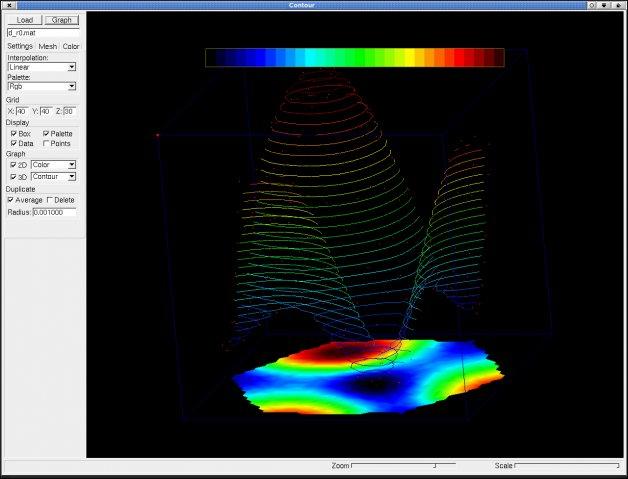
VolView for Windows v.3 2
VolView is an intuitive, interactive system for volume visualization that allows researchers to quickly explore and analyze complex 3D medical or scientific data on Windows, Mac and Linux computers.
VolView v.3. 4. 2001
VolView is an intuitive, interactive system for volume visualization that allows researchers to quickly explore and analyze complex 3D medical or scientific data on Windows, Mac and Linux computers.
SigmaPlot v.12.1.0.15
SigmaPlot is an application that can produce high-quality graphs without spending hours in front of a computer.
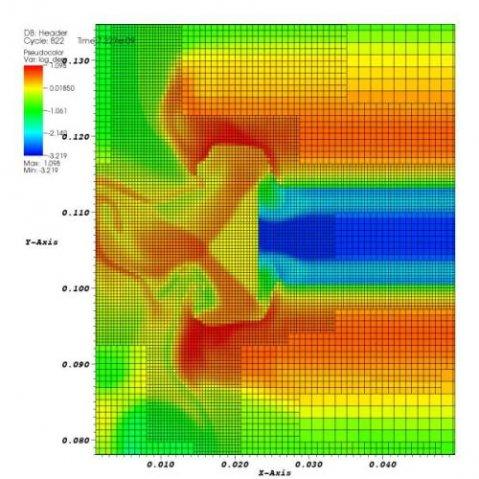
VisIT v.4 22
VisIt is a free interactive parallel visualization and graphical analysis tool for viewing scientific data on Unix and PC platforms. VisIt contains a rich set of visualization features so that you can view your data in a variety of ways.
Rt-Plot v.2.8.10.84
Rt-Plot is a tool to generate Cartesian X/Y-plots from scientific data. You can enter and calculate tabular data. View the changing graphs, including linear and non linear regression, interpolation, differentiation and integration, during entering.
OpenAnalyser v.0.6.2.1
Scientific data analysis made easy. OpenAnalyser is a Java software for scientifc data analysis. It was especially designed to analyse cardiovascular florescence imaging data. OpenAnalyser provides a simple, yet strong plugin system,
Pyphant v.1.0
Pyphant is a framework for scientific data analysis.
The VisIt Visualization System v.3
VisIt is an interactive parallel visualization and graphical analysis tool for viewing scientific data.